PROVIDE YOUR INPUT
For this engagement, we are asking participants to select up to 5 locations from the map that you consider to be high-priority areas for the project team to look at further.
Please use the drop down menu for each location to select one of the pre-populated intersections.
Note: the
numbers on the map are not a priority sequence, rather just the listing when
the initial investigation took place.
Press Submit once you have provided your input.
Survey will remain open until Friday, November 6.
ABOUT THE PROJECT
Project overview
What we are doing:
- Identifying and prioritizing locations throughout Calgary where there are opportunities to improve truck flow and safety
- Identifying candidate locations for improvements, especially ‘quick wins’, i.e. low-cost improvements that The City could reasonably implement in the next 3-5 years. Some examples of potential quick wins are changed signal timings, priority left-turn signals for trucks, extended left-turn lanes, or intersection improvements.
Why?
- Ensure Calgary remains competitive by maintaining and improving the goods movement network to support industrial areas and commercial traffic generators
- Project initiated by the Goods Movement Advisory Group, acting on the Calgary Goods Movement Strategy
Outcome:
- List of priority locations and potential improvements, with potential impacts assessed by benefit-cost analysis for consideration in The City’s capital and operational budgets
Purpose of this engagement
To gather your feedback about potential locations where there are issues affecting truck flow and safety, what those issues are, and what you see as potential solutions.
Approach to date
To date, the project team has developed an initial list of locations to be considered for further study, called “Tier 1 locations.” Based on the available information during the period when COVID was most active, we compiled and selected locations for further study, using a data-driven rules-based approach:
i. Compiled locations from sources, including:
- Locations with highest number of truck involved collisions
- 311 complaints with relevance to “truck”
- Other locations under study by City staff
ii. Confirming locations have high-truck volume or part of a broader corridor of interest
iii. Filtered out locations where recent improvements have been made or team believes there are no low-cost improvements
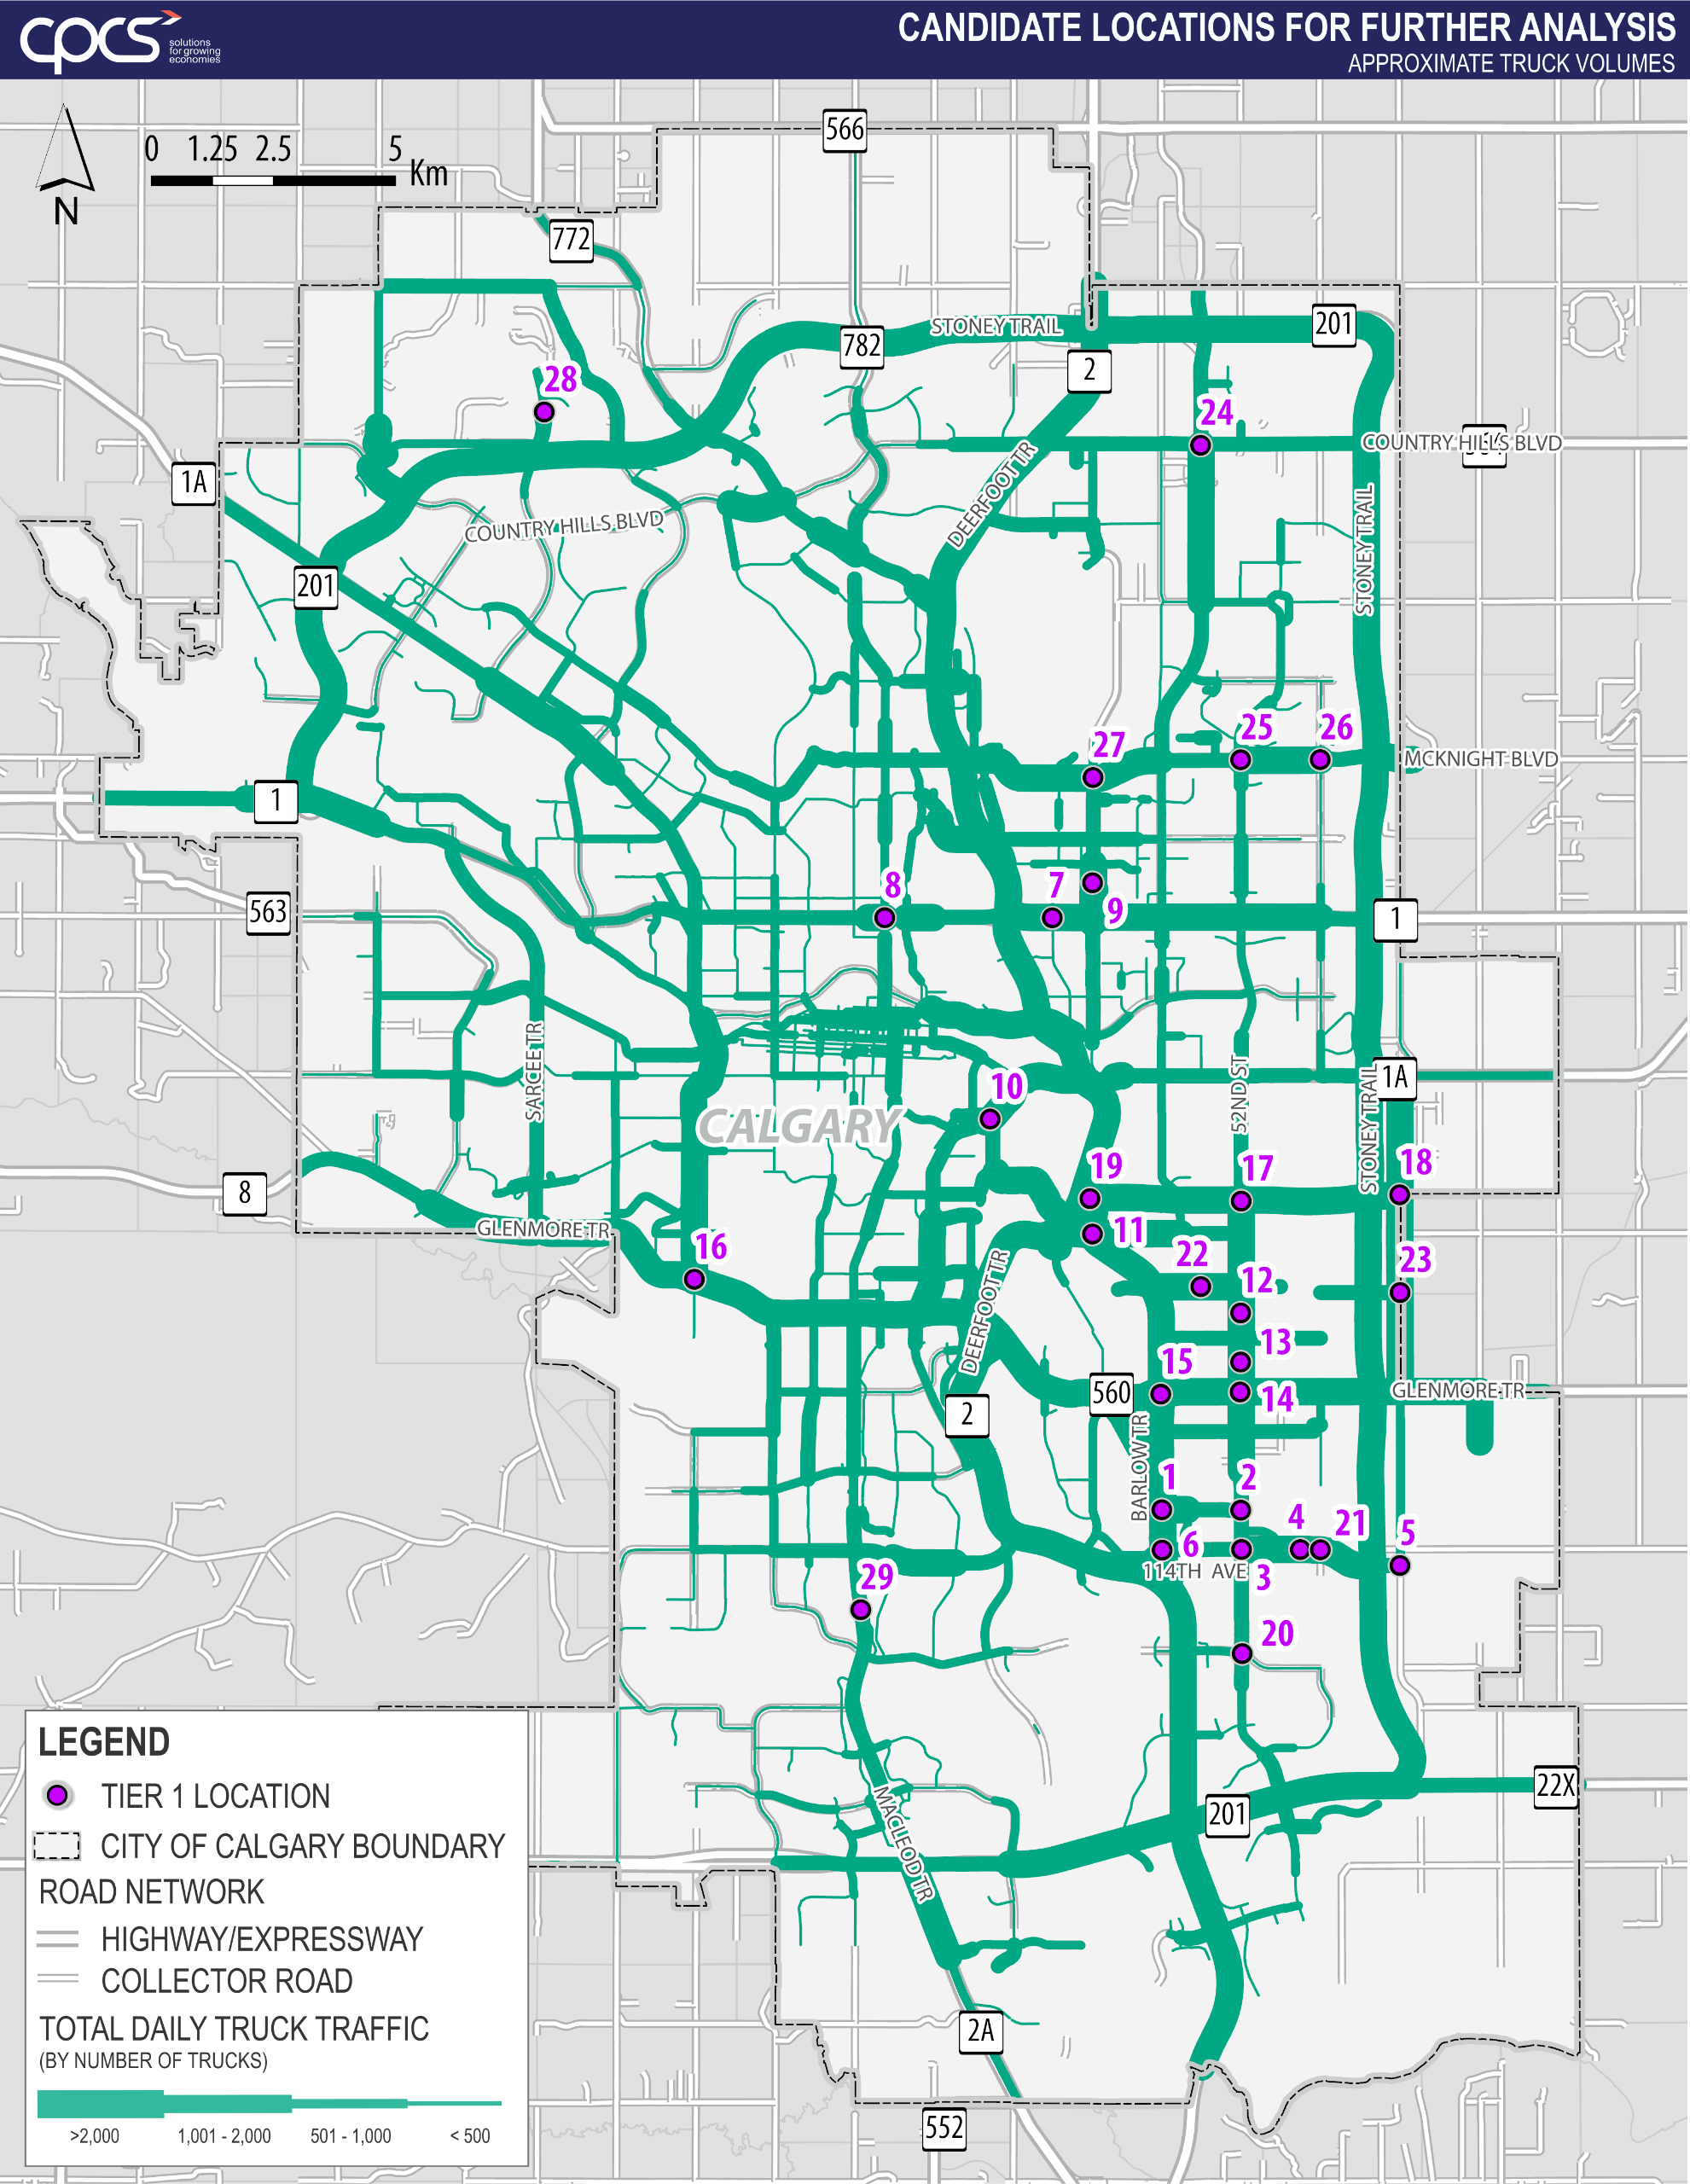
These locations are shown in the map below. The numbers are provided for ease of reference only; they are not priorities. These are locations that we consider meriting further examination in the remainder of the study and does not mean that a solution will be developed at these locations.
Your input will be used to inform whether these are the right locations for further study, and what some of the issues and solutions are that can be assessed in the next steps of the study.


